CELLULAR
SIGNAL MAPPING.
Measure real-world 4G LTE and 5G NR performance by location, carrier, and cellular band. Turn GPS-referenced field measurements into actionable maps for site selection, coverage verification, and network planning.
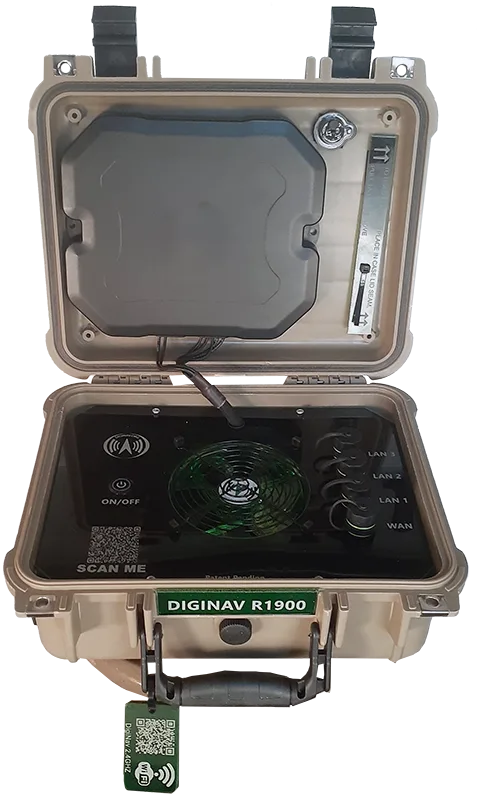
A portable field platform that turns ordinary road miles into actionable network evidence.
Rugged by design
Portable cellular hardware configured for drive-testing and repeatable field collection—not a theoretical desktop coverage model.
Location matters
Cellular readings are associated with GPS position and collection time, making them useful for spatial comparison.
More than signal bars
Signal quality, radio identity, network characteristics, and performance metrics provide a more complete field picture.
BEYOND THE
SIGNAL BARS.
Carrier coverage maps are generally based on propagation models. Our survey approach gathers location-specific measurements from operating cellular equipment so teams can investigate what the network is actually doing along a route or at a site.
Carrier & band identification
Record the serving carrier, cellular band, cell identity, and network identifiers such as MCC and MNC. Compare observations by provider and radio technology, including LTE and 5G NR where supported by the survey equipment.
Radio signal measurements
Collect RSRP (reference signal received power), RSRQ (reference signal received quality), RSSI (received signal strength indicator), and SINR (signal-to-interference-plus-noise ratio). Together these help distinguish weak signal from interference or degraded radio quality.
GPS & time correlation
Associate readings with geographic coordinates and timestamps. The resulting route-by-route data can be compared across sites, corridors, carriers, and collection periods rather than relying on a single signal reading.
Performance & heatmaps
Where captured, analyze download and upload throughput alongside latency and other service indicators. Export survey records for GIS processing, including Esri ArcGIS, to create maps showing sampling locations and geographic variation.
FROM FIELD
TO FINDING.
A documented survey workflow starts with a configured portable cellular field unit. Measurements are collected while traveling the selected route, associated with GPS position and time, and transferred for geospatial processing. The source presentation describes automatic cloud logging, CSV export, and import into Esri software.
Activate
Power the configured field unit and begin automated recording.
Survey
Drive the selected roads and collect location-associated cellular measurements.
Process
Retrieve field logs and prepare the data for ArcGIS mapping and analysis.
Interpret
Examine geographic patterns, potential gaps, and operational implications.
Methodology summarized from Digital Navigator's published cellular signal mapping page. Survey configuration, calibration, sample dates, and map legends should be included in any formal procurement or scientific report.
THE TERRAIN
DOESN'T LIE.
Maps can visualize where readings were collected and how measured upload speed, download speed, latency, or radio conditions vary geographically. Comparing carriers and bands requires consistent survey methods and clearly identified datasets.
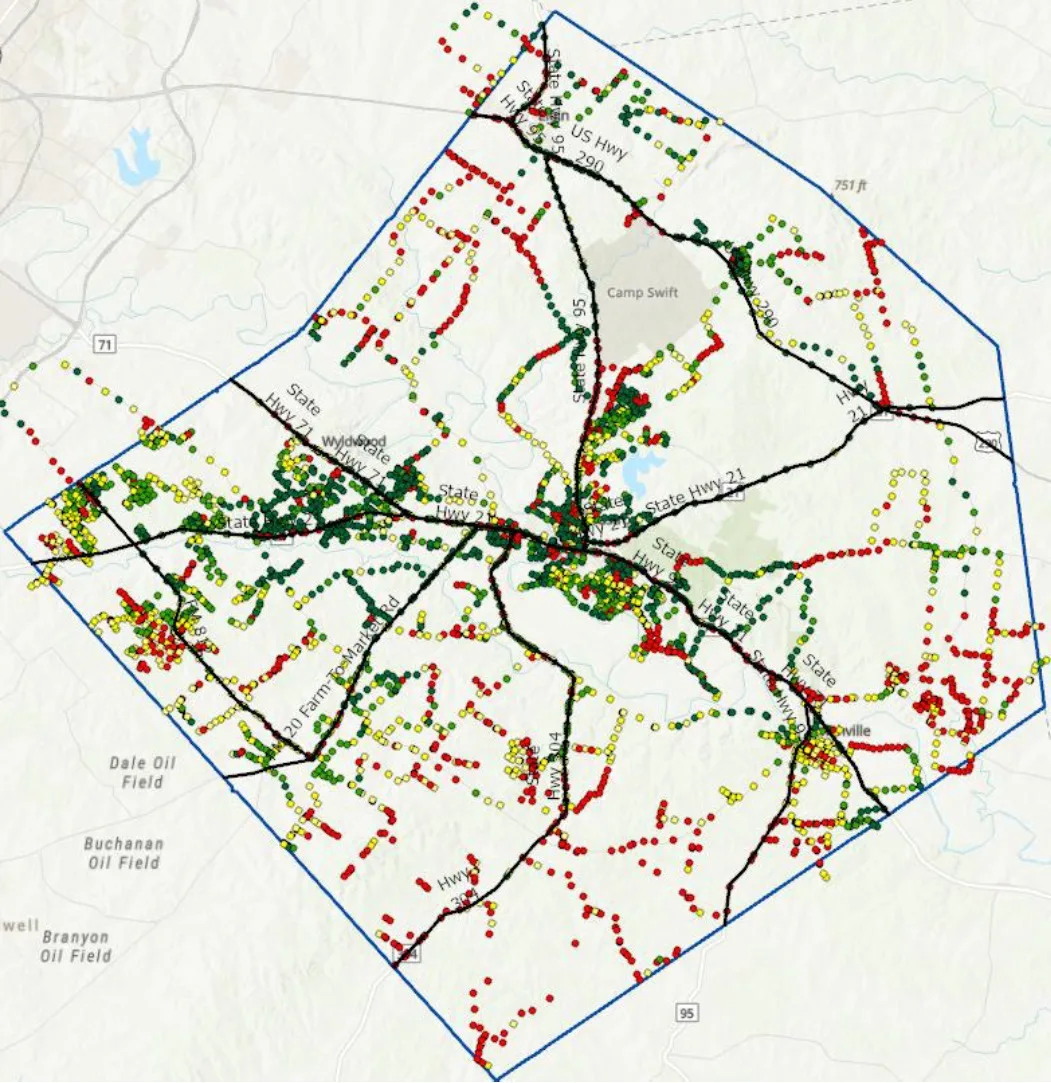
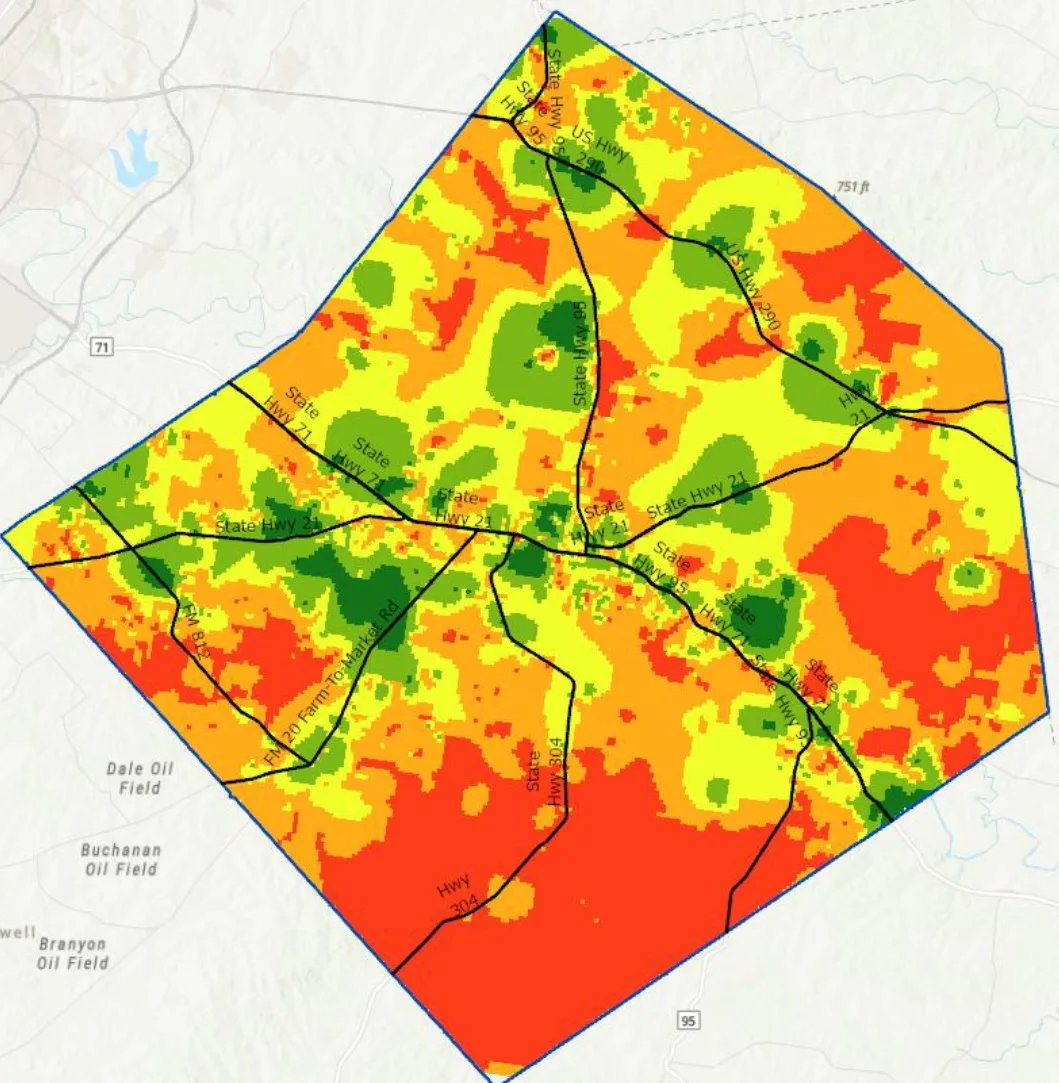
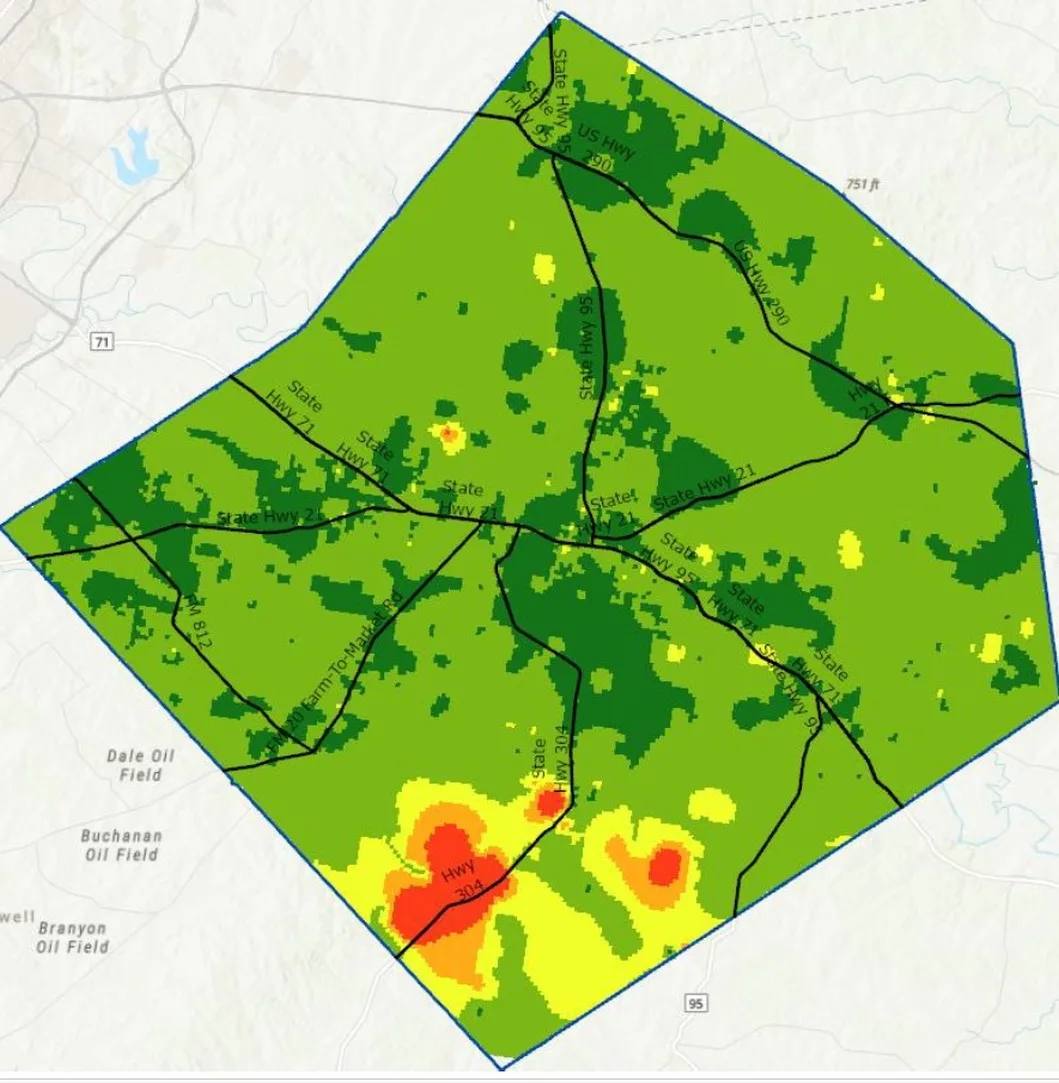

MAPS ARE THE BEGINNING OF THE QUESTION.
Color surfaces show spatial variation, but a defensible assessment also requires the measurement legend, collection period, carrier and radio configuration, interpolation method, and sampling coverage.
These published illustrations demonstrate the visualization approach; they should not be interpreted as current coverage guarantees or as a complete scientific dataset.
Signal environment
RSRP, RSRQ, SINR, RSSI and related radio indicators.
Network context
Carrier, cell ID, band, location, and collection time.
Service behavior
Latency, packet loss, and throughput where recorded.
Measurement detail: Survey data can include date/time, GPS coordinates, carrier, cellular band, RSRP, RSRQ, SINR, RSSI, serving cell ID, MCC/MNC, and 5G NR measurements. Availability of individual fields depends on the router, modem, firmware, and logging configuration.
Image source: Digital Navigator's public signal-mapping page. All image references use the /images/ directory on this website. Upload the map images and hardware photograph there.
INTELLIGENCE
FOR DECISIONS.
Coverage intelligence is valuable when it informs a real-world decision. The same collection and analysis discipline can support several government and infrastructure missions.
Public safety communications
Identify areas that merit carrier-specific field verification before deploying mobile data systems.
Emergency management
Support communications contingency planning for response corridors and temporary incident sites.
Rural broadband planning
Compare field observations with stated service availability and prioritize follow-up investigation.
Infrastructure investment
Use geospatial evidence to frame network improvement discussions and site-specific testing plans.
THE DATA.
THE CONTEXT.
THE LIMITS.
Good field science distinguishes direct observation from interpretation. A survey can describe what was measured at particular locations and times; broader coverage claims require appropriate sampling, documentation, and analytical validation.
Survey maps are evidence of observed conditions within a documented study design—not proof of present-day service availability everywhere. Formal studies should disclose the dates, instrumentation, tested carriers, route selection, sampling intervals, analytical processing, and limitations.